SCADA temperature
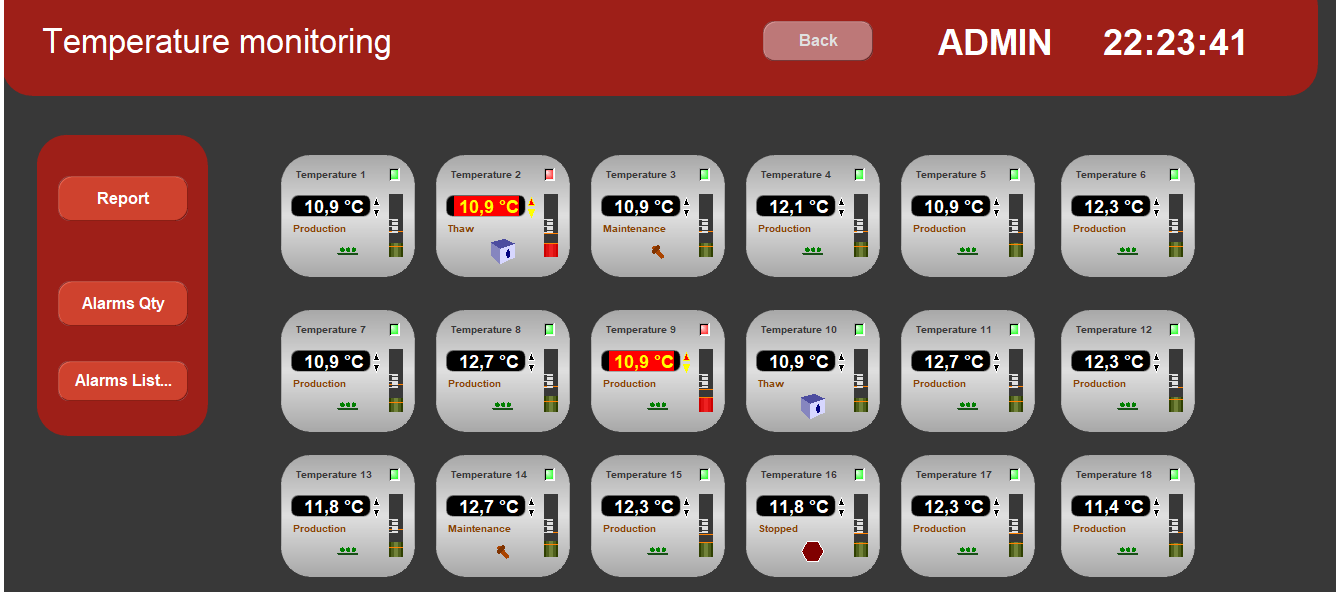
Temperature monitoring software tracks and controls sensor values in real time. Data is stored in the database and reports are generated. The SCADA database system can keep data stored and generate statistical reports. The temperature statistics show the behavior of the variations. Some items displayed are alarms and status at each moment. Temperature values are read by the software through communication protocols. SCADA Software uses drivers with protocols for each type of equipment. It can be serial, ethernet, camera or Wifi.
Temperature software
1 - Download and install the software: Download
2 - Download a simple example and unpack in a new folder: Example
Temperatures generally vary with the resolution of one decimal place.
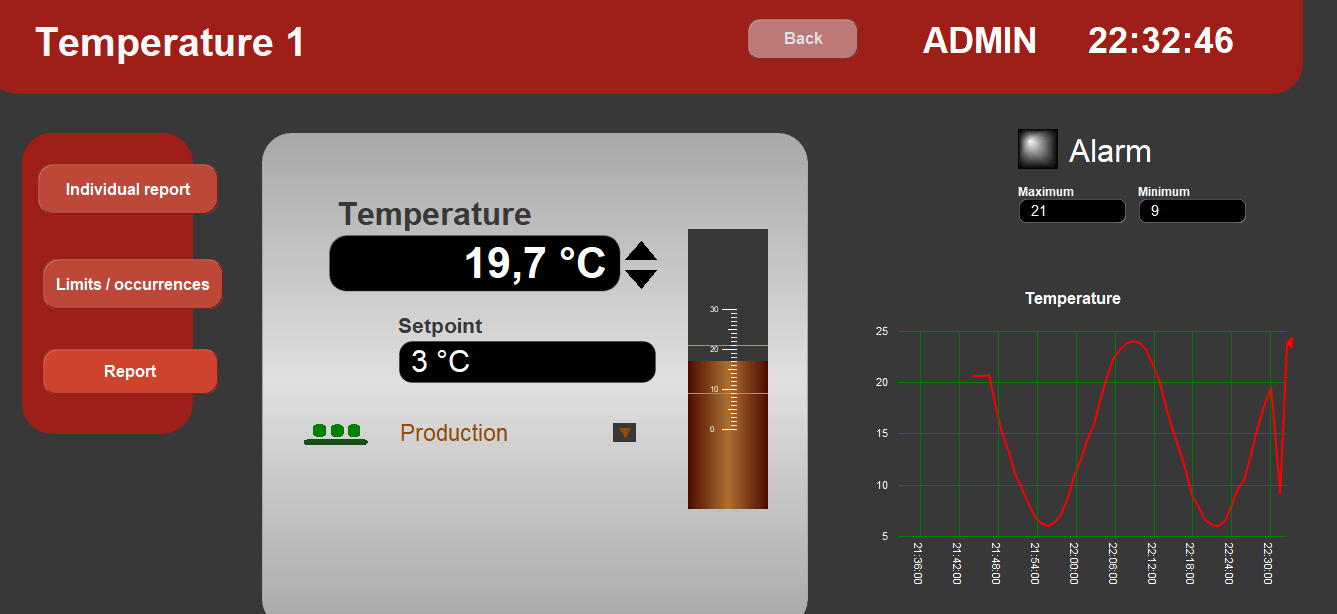
Each device or sensor can have maximum and minimum limits configured in the software.
The SCADA Software has configuration of lower limits and superiors limits for each tag.
If the temperature values exceed the maximum or minimum value, the alarm is displayed and stored.
But in some cases, the temperature monitoring variation time is used to wait for the alarm.
There are also status definitions.
Status of the equipment, sensor or environment can be, for example, in production, in defrost, in maintenance or stopped.
Depending on each status, alarms and follow-ups are classified according to the settings in the software.
Database and monitoring
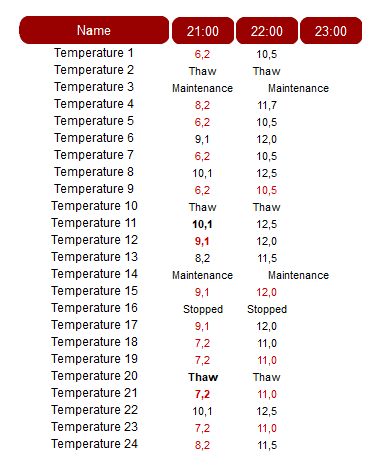
To store temperature information in the database software, the time between each recording is configured. For example every minute or every second. Real-time readings of the monitoring can be faster depending on each need. The SCADA allows defining the time between each reading and the time between each storage. The report can be generated based on the date you want. This report presents the statistical data that occurred during the procedures.
1 - Download and install the software: Download
2 - Download a simple example and unpack in a new folder: Example
Design, protocol and configuration
Screen design can be placed as you like. Defining which values are displayed on the monitoring screen. Several types of objects are available. Bars, displays, editors, combos, drawings, graphics, etc. Select which object you want to use, associate it with the tag, and define the parameters in the software. The SCADA has the option of drawing the background of the screen, defining figures related to the tags and creating several pages for each group. The automatic readings of the temperature sensors are configured in the tag sheet. Names, titles, units, parameters and serial or TCP settings are placed. One of the protocols used is MODBUS.
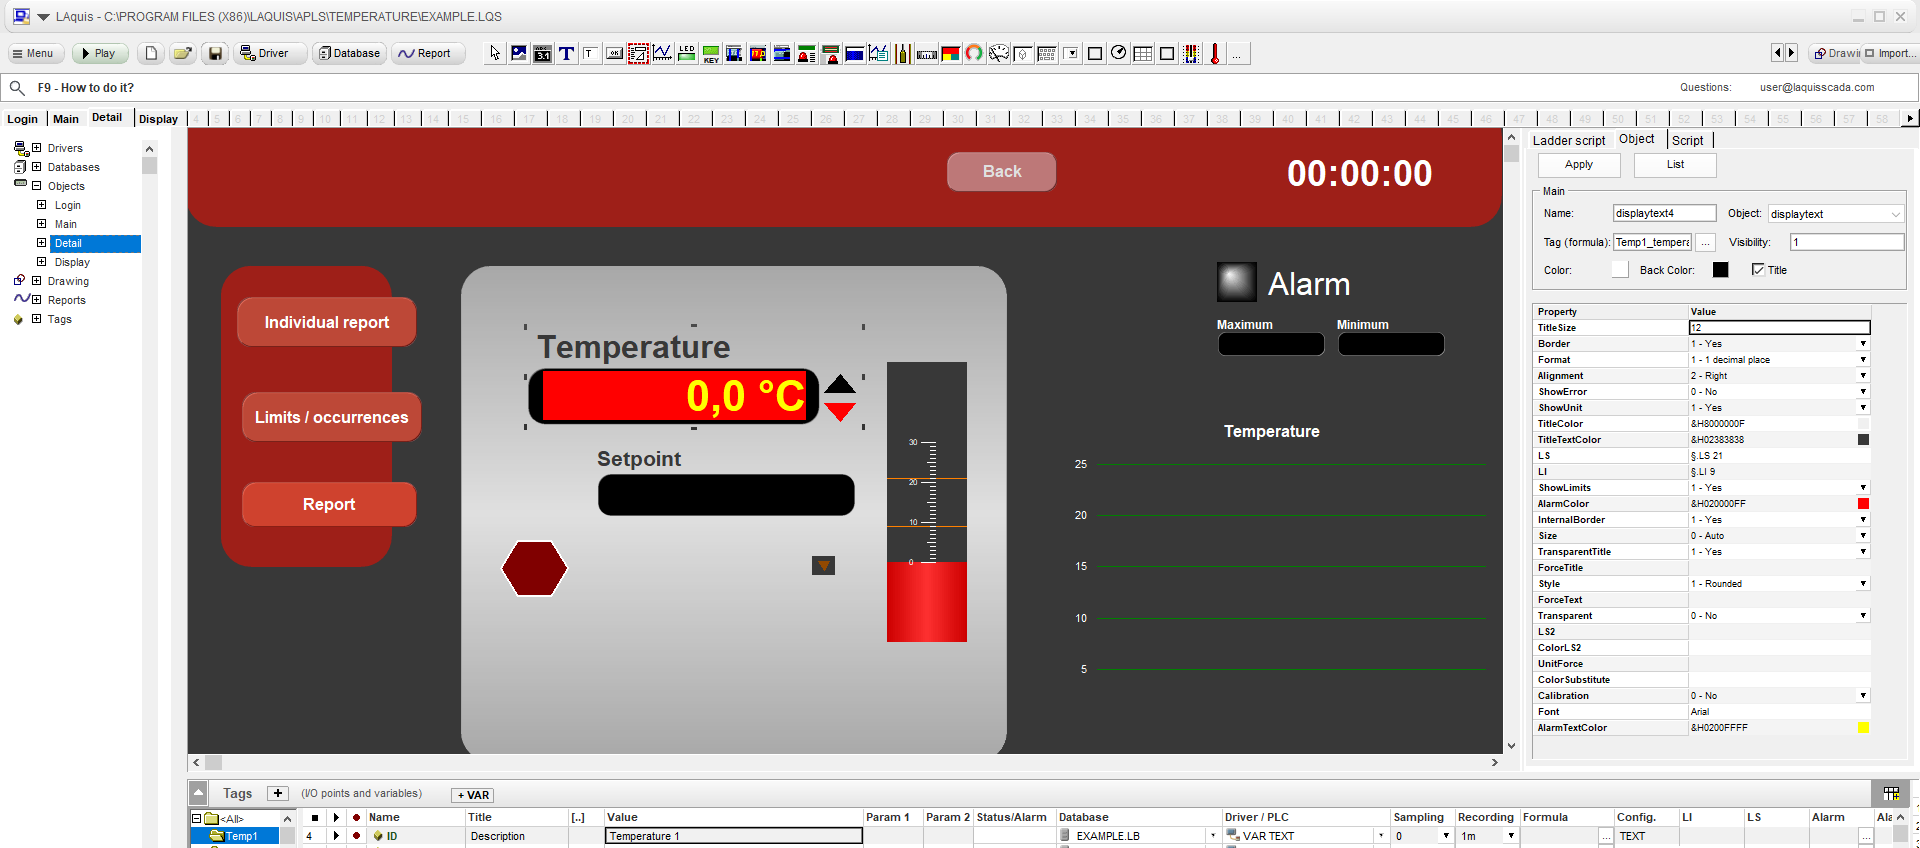
Sometimes MODBUS RTU or MODBUS TCP. These protocols are defined in the Driver / PLC column.
But the protocol address values are placed in column Param1 and Param2.
In the SCADA Software it is configured for each tag: which driver, parameter, address and port.
Each group of tags can represent a device or an environment.
Information is sent over cables or the network in the monitoring.
Calibration of temperature monitoring values is important for defining the uncertainty of numbers.
Temperature units can be set to °C or °F.
In the case of the status of each equipment, the tag can be configured with whatever list you want.
By clicking on Status/Alarm a database from this list is defined.
But to edit the database, just click on Database and select the database.
In this SCADA Software, the default database is local, keeping the history, but it can be exported to others.
Each instrument can have a temperature, setpoint, status and limits.
Other tags can be added according to each monitoring case.
1 - Download and install the software: Download
2 - Download a simple example and unpack in a new folder: Example